Global Trade
The AI Trade Revolution: Reshaping Global Commerce
May 28, 2026
Global Trade
Master sales analysis to drive business growth. Learn key metrics, forecasting, and strategies for success.
April 21, 2026By Davos Pham17 min readView as Markdown
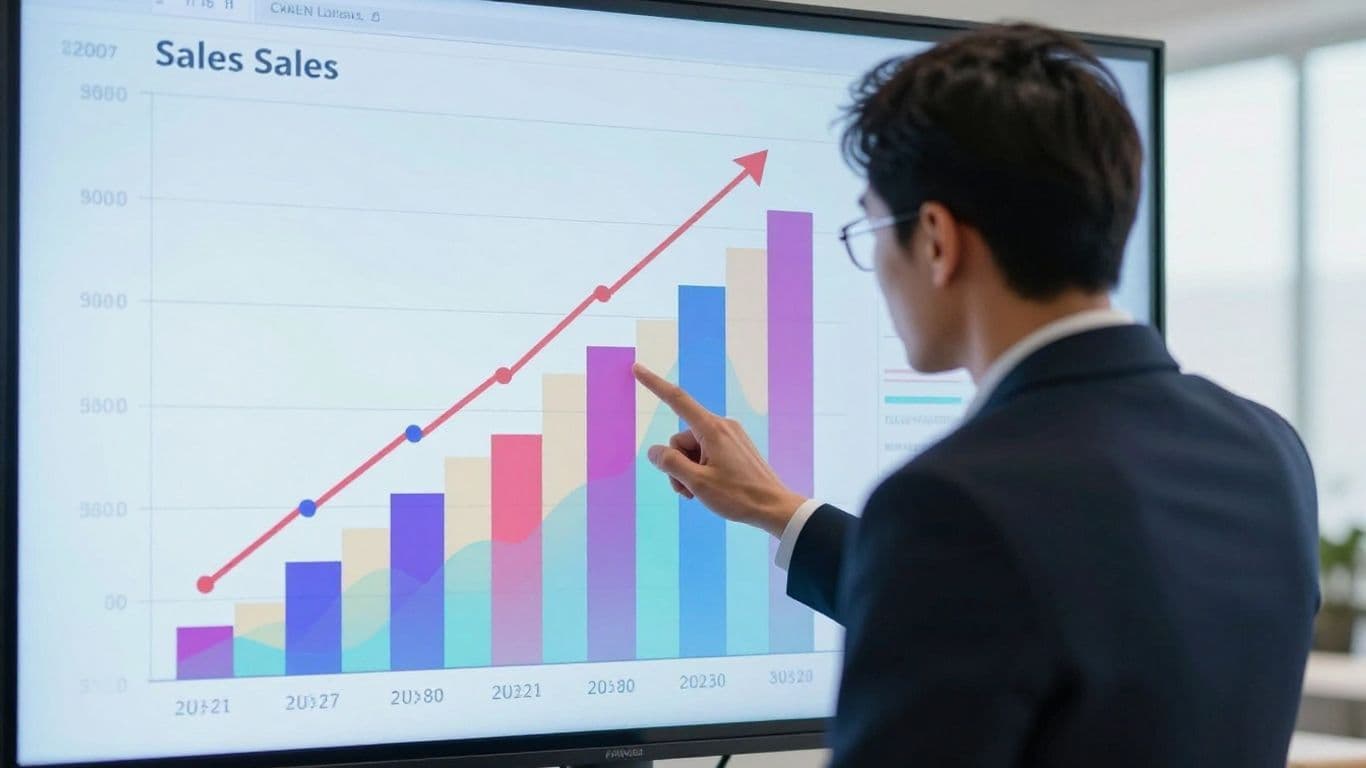
Looking to boost your business? It all starts with understanding what's happening with your sales. We're talking about sales analysis, which is basically digging into your sales numbers to figure out what's working and what's not. It might sound complicated, but it's really about making smart choices based on actual facts, not just guesses. This helps you sell more, keep customers happy, and ultimately grow your company. Let's break down how to get a handle on your sales data.

Sales analysis is basically looking at your sales numbers to figure out what's working and what's not. It's not just about seeing how much you sold last month; it's about digging deeper to understand why you sold that much, or why you didn't sell enough. This process helps you make smarter choices about where to put your time and money to actually grow your business. Think of it like a doctor checking your vital signs – it tells you if you're healthy, if you need to change your diet, or if something more serious is going on.
At its heart, sales analysis is the practice of examining sales data to spot patterns, trends, and useful information. This information then guides you in making better decisions. Instead of just guessing, you're using facts to steer your company. It's about understanding your customers better, seeing which products are flying off the shelves, and figuring out the best ways to reach more people.
Without data, sales analysis is just guesswork. Sales data is the raw material. This includes everything from how many units you sold, to how much money came in, to who bought what and when. The more detailed your data, the clearer the picture you get. It's like trying to bake a cake without knowing how much flour or sugar you have – you're unlikely to get a good result.
Here's a quick look at what kind of data is important:
To really get value from your sales data, you need a few things in place. It's not just about having the numbers; it's about what you do with them.
The real power of sales analysis comes when you can translate raw numbers into clear steps that improve how you sell and who you sell to. It's about turning information into action that makes a difference to your bottom line. This means looking beyond just the total sales figure and understanding the 'why' behind it.
So, you've got all this sales data floating around. What do you do with it? Well, that's where sales analysis really shines. It's not just about looking at numbers; it's about figuring out what those numbers are trying to tell you so you can actually do something with them. Think of it as your business's crystal ball, but way more reliable because it's based on actual facts.
Ever wonder why some products fly off the shelves while others gather dust? Sales analysis can help you figure that out. By digging into purchase histories, you can spot patterns in what people are buying, when they're buying it, and even who's buying it. This isn't just trivia; it helps you stock the right stuff and market it to the right people. Understanding your customer's journey is key to making them stick around.
Here’s a quick look at what you might uncover:
Nobody likes having too much stock sitting around, costing money, or running out of popular items right when people want them. Sales analysis helps you get that balance just right. You can look at historical sales data to predict demand more accurately. This means less wasted money on unsold goods and happier customers who can actually buy what they came for. It also helps streamline your sales team's day-to-day work, making sure they're focusing on the most promising leads and activities.
Pricing is tricky, right? Too high and you scare customers away; too low and you leave money on the table. Sales analysis gives you the data to make smarter pricing decisions. You can see how price changes have affected sales in the past, what your competitors are doing, and what price points your customers seem most comfortable with. This kind of insight helps you set prices that maximize both sales volume and profit. It’s all about finding that sweet spot that works for everyone. For more on making sales analysis simple and effective, check out actionable steps for sales analysis.
Sales analysis transforms raw transaction data into a narrative about your business's performance and customer behavior. It's the process of dissecting sales figures to find out what's working, what's not, and why, ultimately guiding smarter business decisions.
Looking at numbers is how you really figure out what's working and what's not in your sales efforts. It’s not just about how much money came in, but why and how. Tracking the right stuff helps you see the big picture and make smarter moves.
Revenue is the top line, the total money you bring in from sales. But just seeing that number go up isn't the whole story. You also need to look at profitability – how much of that revenue is actually profit after you pay for everything. A company can sell a lot but still not make much money if their costs are too high. So, keeping an eye on both is pretty important.
Here’s a simple way to think about it:
Watching these numbers over time, maybe month-to-month or quarter-to-quarter, shows you if your business is getting healthier financially. Are your sales growing faster than your costs? That's a good sign.
Sales volume is pretty straightforward: it's the number of units or deals you've closed. High volume can mean a lot of activity, but it doesn't always mean high profit. That's where conversion rates come in. A conversion rate tells you how many leads or opportunities actually turned into paying customers. For example, if you talk to 100 potential customers and only 10 buy, your conversion rate is 10%.
Understanding your conversion rate at different stages of your sales process is key. If lots of people are looking at your product but few are buying, something in your pitch or pricing might need a tweak. Or maybe the leads you're getting aren't the right fit.
Here are some common conversion points to track:
Improving these rates means you're getting more out of the effort you're already putting in. It's about working smarter, not just harder.
Average deal size is simply the average amount of money you get from each sale. If you sell 100 items for $10 each, your average deal size is $10. If you sell 10 items for $100 each, your average deal size is $100. Knowing this helps you set realistic sales targets and understand the value of each customer interaction. A higher average deal size usually means more revenue with potentially less overall effort, assuming your costs don't skyrocket.
Sales cycle length is the time it takes from when a potential customer first shows interest to when they actually make a purchase. Some sales might take a few hours, while others could take months or even years, especially for big business deals. Shortening this cycle means you can close more deals faster, which generally leads to more revenue and better cash flow. Analyzing where deals get stuck can help you speed things up. Maybe follow-up emails are too slow, or the proposal process takes too long. Fixing these bottlenecks can make a big difference.
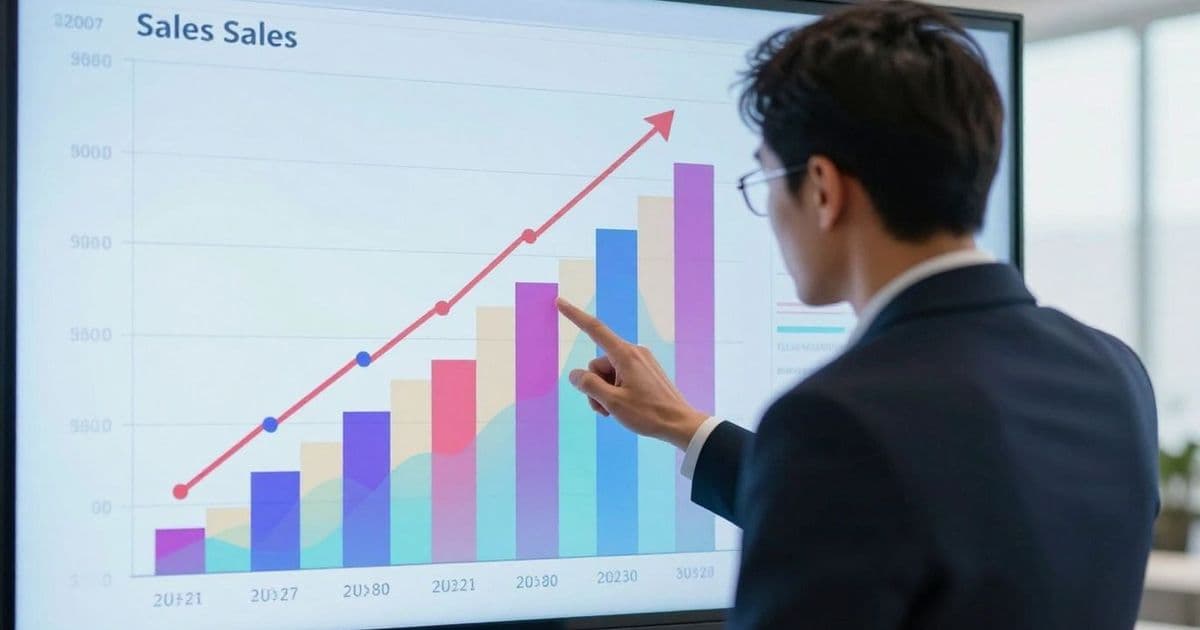
Looking ahead is just as important as looking back. That's where forecasting and predictive insights come into play. It's about using what we know from past sales to make educated guesses about what's going to happen next. This isn't just about guessing games; it's about using data to make smarter moves.
Getting your sales forecasts right is a big deal. It helps you figure out how much money you're likely to bring in, which then helps you plan everything else – from how much stock to order to how many people you might need on your team. To build a good forecast, you need to look at your sales history. What sold well? When did it sell well? Were there any big promotions that skewed the numbers? You also have to consider what's happening outside your business, like new competitors or changes in the economy.
Here's a simple way to think about it:
Predictive analytics takes forecasting a step further. Instead of just looking at past trends, it uses sophisticated algorithms to find hidden patterns and predict future outcomes with more precision. This allows businesses to move from reacting to market changes to proactively shaping their future. Think about it: if you can predict which products customers will want next, or which marketing campaigns are most likely to succeed, you can put your resources where they'll do the most good. It's about getting ahead of the curve.
Predictive analytics helps us see around corners. It's not about knowing the future with certainty, but about making the most informed decisions possible based on the data we have and the patterns we can identify. This foresight is what separates businesses that just survive from those that truly thrive.
The market is always changing, and staying on top of those shifts is key. Predictive analytics can help you spot emerging trends before they become obvious to everyone else. This might mean noticing a growing interest in a certain type of product, or seeing that a particular customer segment is becoming more active. By understanding these signals, you can adjust your product offerings, marketing messages, and sales strategies to match what's coming next. It’s about being agile and ready for whatever the market throws your way.
So, you've got your sales data humming along, and you're tracking all the important numbers. That's great! But are you really getting the most out of it? This section is all about looking at where your sales are coming from and who your best customers are. It’s not just about making a sale; it’s about making the right sales and keeping those good customers coming back.
Think about all the ways people can buy from you. Maybe it's your website, a physical store, social media, or even through partners. Each of these is a 'channel'. We need to figure out which ones are actually bringing in the most money and which ones are just costing you time and resources. It’s like checking which fishing spots are actually catching fish, and which ones are just pretty to look at.
Here’s a quick way to see how your channels stack up:
Channel | Revenue Generated | Cost to Operate | Profit per Channel |
|---|---|---|---|
Online Store | $50,000 | $5,000 | $45,000 |
Retail Store | $30,000 | $8,000 | $22,000 |
Social Media | $10,000 | $2,000 | $8,000 |
Partner Sales | $25,000 | $3,000 | $22,000 |
Looking at this, you can see the online store is doing really well. Maybe you want to put more effort there. The retail store is okay, but it costs more to run. Partner sales are also strong. Social media brings in some sales, but it’s a smaller piece of the pie.
Not all customers are created equal, right? Some buy a lot, some buy often, and some just buy once. We need to find those customers who are really important to your business – the ones who spend the most or buy the most frequently. These are the customers you want to keep happy and get more business from.
How do you spot them?
Once you know who these people are, you can do things like offer them special deals, early access to new products, or just give them a bit of extra attention. It’s usually cheaper to keep a good customer than to find a new one.
Keeping customers is just as important, if not more so, than finding new ones. Sales analysis can show you why customers leave and what makes them stay. If you see a lot of customers stop buying after their first purchase, you need to figure out why. Was it the product? The service? The price?
Analyzing customer feedback alongside sales data can reveal patterns in dissatisfaction. If multiple customers complain about a specific issue after a certain point in their buying journey, it's a clear signal that something needs fixing before more people churn.
By understanding what makes customers stick around – maybe it's great customer support, a product that really solves their problem, or a loyalty program that feels rewarding – you can focus on doing more of that. It’s all about making sure people have a good experience so they don’t even think about going elsewhere.
It's pretty wild how much technology has changed the game for sales analysis. Gone are the days of just scribbling numbers in a notebook or relying on gut feelings. Today, we've got tools that can crunch massive amounts of data, giving us a much clearer picture of what's really going on.
Think of technology and sales analysis as a team. Technology provides the horsepower – the systems and software – to collect and process all that sales information. Analytics, on the other hand, is the brain that makes sense of it all. This combination is what lets us move beyond just reporting past sales to actually understanding why they happened and what might happen next. It’s not just about having data; it’s about having the right tech to turn that data into useful insights.
One of the biggest game-changers is real-time data. Imagine a sales rep talking to a customer and instantly seeing their purchase history, past interactions, and even potential issues. That’s the power of real-time analytics. It means we can react much faster to customer needs or market shifts. Instead of waiting for a weekly report, we can adjust our approach on the fly.
Here’s a quick look at how real-time data helps:
The speed at which we can now access and act on information is incredible. It means fewer missed opportunities and a more responsive sales process overall.
There's a whole suite of technologies out there designed to help us dig deeper. We're talking about Customer Relationship Management (CRM) systems that track every customer touchpoint, business intelligence (BI) platforms that visualize complex data, and even AI-powered tools that can predict future sales trends. These aren't just fancy gadgets; they are practical instruments that help us:
For example, a CRM system might show that customers who buy product A are also highly likely to buy product C within six months. This kind of insight, powered by technology, lets us create targeted marketing campaigns or special offers that are much more likely to succeed than a generic approach.
So, we've gone over a lot about looking at sales numbers. It's not just about counting sales, right? It's about really digging in to see what's working and what's not. Using the data helps you figure out what customers actually want, how to keep your stock just right, and even how to price things so you're making money but still attracting buyers. Plus, knowing who your best customers are lets you focus your efforts where they count the most. It might seem like a lot of work at first, but getting a handle on your sales data is a smart move for any business that wants to grow and do better in the long run. It’s about making choices based on facts, not just guessing.
Sales analysis is like being a detective for your business's sales. You look at all the information about who bought what, when, and why. This helps you understand what's working well and what's not, so you can make smarter choices to sell more and make more money.
You need details about your sales, like how much you sold, how much money you made, and who your customers are. Think of it like collecting clues: customer names, what they bought, when they bought it, and how much they paid. The more details you have, the better you can understand your sales.
By studying sales data, you can see what kinds of products people like most, what times they tend to buy, and what they're willing to pay. This helps you know what your customers really want, so you can offer them things they'll love and keep them coming back.
Some key numbers to track are how much money you're making overall (revenue growth), how many sales you're actually closing (conversion rates), how much each sale is worth on average (average deal size), and how long it takes to make a sale (sales cycle length). Watching these helps you see if you're doing a good job.
Yes! By looking at past sales patterns and using smart tools, you can make educated guesses about future sales. This is called forecasting. It helps you prepare for busy times, know when to stock up on products, and plan for new things to sell.
Technology, like special computer programs (software), can do a lot of the hard work for you. These tools can collect data quickly, show you important information on easy-to-read charts, and even help predict what might happen next. This lets you make decisions faster and more confidently.
Enter your email to receive the latest trade insights, guides, and HS-code explainers from EximAgent Blog.